Every time oil goes up, it's on the news and it's on the pumps within days. Every time oil comes down, drivers wait. And wait. There's even a name for it: "rockets and feathers". Prices go up like a rocket and come down like a feather.
It's one of those things everyone believes, so we decided to test it. We took the daily average price of petrol and diesel from every UK forecourt that reports to the Government's Fuel Finder scheme, and lined it up against the price of Brent crude, the oil price you hear quoted on the news, converted into pence per litre.
Here's what we found.
It's been a wild year for oil
First, some context, because 2026 has been anything but steady.
At the start of February, Brent crude was around $72 a barrel. By 7 April it had almost doubled to $138. Then it fell all the way back to $68.50 by the start of July, before climbing again to around $125 today.
That's a lot of movement, which makes it a great year to see how pump prices respond.
| Month | Brent crude, per barrel | Average petrol | Average diesel |
|---|---|---|---|
| February | $71 | 135.8p | 148.2p |
| March | $104 | 144.7p | 165.7p |
| April | $117 | 157.4p | 189.2p |
| May | $108 | 158.4p | 186.3p |
| June | $85 | 155.2p | 175.3p |
| July | $83 | 153.9p | 169.5p |
| August | $92 | 161.5p | 182.3p |
| September | $114 | 170.0p | 193.1p |
| October so far | $127 | 174.8p | 200.0p |
You can already see something odd in that table. Oil fell by more than a quarter between April and July. Diesel fell with it. Petrol barely moved.
The chart makes it clearer. For each fuel, the coloured line is what it actually cost. The grey line is where it would have been if, from 1 February, it had simply moved penny for penny with crude oil, about a week later, with VAT on top.
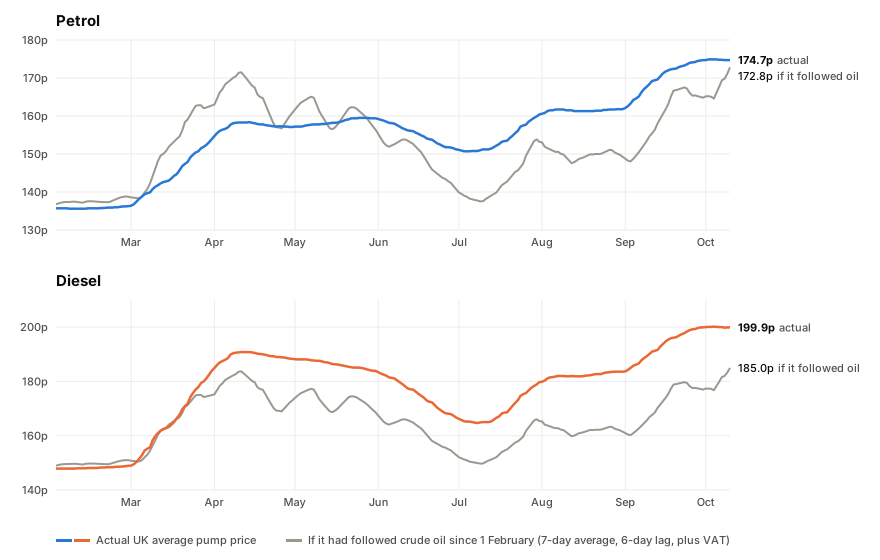
Watch petrol through June and July. The grey line drops sharply as oil falls. The blue line only dips a little. By early September petrol was about 15p a litre above where oil alone would have put it. It's only close to the grey line again now because oil has climbed back up to meet it.
Diesel has its own gap, and it opened at a different moment. It kept pace with oil all the way up, then didn't come down when oil first started to fall in April. We'll come back to that.
How quickly do pump prices react?
Quickly, at least on the way up. When we compared week-by-week changes, pump prices lined up best with the oil price from five or six days earlier. That's roughly how long it takes for a move in crude to work through wholesale prices, deliveries and forecourt price boards.
So when you hear oil has jumped, you've got about a week before you see it at the pump.
Diesel moves with oil, but kept a bit extra
Diesel looks better behaved than petrol at first. Then you look closer.
On the way up, it kept pace with oil almost exactly. In mid-March diesel was within a penny of where oil alone would have put it, and it hit its peak of 190.8p on 11 April, days after crude did.
Then oil started to fall, and diesel didn't follow straight away. In the three weeks after its April peak, the cost of crude dropped by the equivalent of about 10p a litre at the pump. Diesel came down by less than 3p. By the start of May it was 14p a litre above where oil would have put it.
After that, diesel did move with oil in both directions. It fell about 25p from its April peak to early July as crude fell, and rose again with it over the summer. But it never gave back that 14p. It's sat at roughly that distance above the oil line ever since, briefly stretching to 25p in early September, and today it's 15p a litre above where oil alone would put it. That's about £7.50 on a 50-litre tank.
So diesel's feather is a different shape from petrol's. Rather than being slow on every fall, it was slow on one fall, at the top of the spring spike, and banked the difference.
Petrol is a different story
Petrol rose with oil in spring, by 22p a litre between February and April. Fine.
But look at what happened next. Brent peaked on 7 April. Petrol kept going up for another seven weeks, and didn't hit its own high until 25 May, at 159.5p.
Then, as oil kept falling through June, petrol drifted down very slowly. Between April and July, the drop in crude was worth around 19p a litre at the pump once you include VAT. Petrol fell by just 3.4p.
That's the feather.
When oil started rising again in July, petrol went straight back up: 20.5p a litre between July and now. That's the rocket.
We also looked at it week by week across the whole period. In weeks when the cost of crude went up, petrol prices rose noticeably. In weeks when crude went down, petrol hardly moved at all. On average, petrol responded to a rise about seven times more strongly than to a fall.
Why might that be?
We should be honest about what our numbers can and can't tell you.
Crude oil isn't the only cost in a litre of petrol. Refineries turn crude into petrol, and the price they charge for that can rise and fall on its own. Fuel duty and VAT are a big chunk of the pump price too, though duty is a fixed amount per litre, so it doesn't rise and fall with oil. Some of the gap could be explained by refining costs rather than by forecourts.
What we can say is that both fuels went up with oil far more readily than they came down. Petrol was slow on every fall. Diesel was slow on the first big one and never caught up. Either way, drivers are paying more today than the oil price alone would explain, and that's exactly the pattern people have complained about for years.
What can you do about it?
You can't control the oil price. But knowing how the lag works helps a little.
When oil jumps, fill up soon. You've got about a week before it reaches the pumps, so if your tank's half empty, it's worth topping up before it does.
When oil falls, don't wait for petrol to follow. History this year says it won't, or not much. Waiting for the drop is a mug's game.
Shop around, always. Within most towns there's an 8 to 10p a litre gap between the cheapest and dearest station, which is bigger than most weekly swings in oil. Look up your town to see who's cheapest right now.
And if you want to watch how prices are moving, week by week and region by region, our reports page updates every hour.
How we did this: pump prices are the daily UK averages rebuilt from every price change reported to the Government's Fuel Finder scheme since February 2026. Brent crude is the daily Europe Brent spot price published by the US Energy Information Administration, converted to pence per litre using the Federal Reserve's daily pound-to-dollar exchange rate (one barrel is 159 litres). Expected pump changes add 20% VAT to the change in crude. You're welcome to quote any of these figures; a link back is all we ask.